Difference between revisions of "Tutorials:8 Infiltration"
(→Setting up the index map) |
(No difference)
|
Latest revision as of 21:42, 2 May 2009
This tutorial is compatible with:
- WMS Version 8.1
- GSSHA Version 3.0b and later
Disclaimer: GSSHA tutorial exercises do not represent real world conditions
Infiltration is a key loss mechanism in a watershed; no watershed model is complete without it. GSSHA™ has four different infiltration models. During this tutorial you will set up the inputs needed for the Green & Ampt with Soil Moisture Redistribution model.
If you are starting at this tutorial,
- In the 2D Grid Module
 select GSSHA™ | Open Project File.
 - Browse to the Finished_tutorial\streams_embank folder.
- Select the streams_embank.prj file and select Open.
Contents
Index Map Setup
Importing the Shapefile as a GIS Layer
The first step that needs to be done is to set up an index map that describes the spatial variation in parameters needed by the infiltration model. We shall use a soil type shapefile from the SSURGO database of the area to create a soil type index map. Before we do anything with the shapefile in WMS, though, let’s look at it so that we know what we are working with.
- Launch Microsoft® Excel®.
- Select File | Open.
- Browse to the Soils folder of the GSSHA™ tutorial data.
- Using the control key, select both the soil_clip.dbf and IDs_for_WMS.dbf files. Select open.
- If soil_clip.dbf is not the active worksheet change to it by selecting Window | soil_clip.dbf.
- Switch to the IDs_for_WMS.dbf worksheet by selecting Window | IDs_for_WMS.dbf.
- Select Edit | Current Coordinates...
- Select Set Projection.
- Ensure the coordinate system is set to UTM, NAD83, Meters, Zone 16.
- Select OK.
- Select OK.
- Right-click on GIS Layers in the data tree.
- Select Add Shapefile Data.
- Right-click on soil_clip.shp in the data tree.
- Select Join Table To Layer.
- Open the IDs_for_WMS.dbf file.
- Under Shapefile Join Field select mukey.
- Under table data field select classifica.
- Select OK.
- Right-click on soil_clip.shp in the data tree.
- Select Open Attribute Table.
- Make sure that the classifica field was added to the table and hit Ok.
- Right-click on Coverages in the data tree.
- Select New Coverage…
- Change the Coverage Type to Soil Type.
- Hit OK.
- Make sure the Soil Type coverage is the current active coverage by clicking on it in the Coverage list.
- Select the soil_clip.shp GIS layer by clicking on it. This will change the active module to the GIS model
 .
. - In the GIS Module select, Mapping | Shapes -> Feature Objects.
- Select Yes for use all shapes in visible shapefiles.
- Select Next.
- Scroll over to the Classifica column.
- In the drop-down box that says ‘not mapped’ change it to be ‘SCS Soil type’
- Hit Next and then Finish.
- Wait for WMS to convert the shapefile into the coverage.
This is the attribute data that comes in the shape file. Notice that there are four parameters, ‘areasymbol’, ‘spatialver’, ‘musym’, and ‘mukey’. What WMS is looking for is a parameter that will serve as the soil type ID. There is not a suitable one in this file.
This dbf (dbase IV) file has been created to provide the information that WMS needs for the soil_clip shapefile to be useful. Usually when setting up a GSSHA™ model the soils data base file needs to be manipulated so that it has a number that indicates a soil classification. Notice that the previous symbols are there, although the number of lines of data is greatly reduced. Additionally four parameters have been created, ‘newid’, ‘classifica’, ‘erosion’, and ‘descriptio’. Looking at the ‘classifica’ and ‘descriptio’ parameters we can see that the soils were grouped according to soil type classification.
|
First we want to bring in the soil_clip shapefile as a GIS layer. You can close Excel® and switch back to WMS.
Browse to the Soils folder and open the soil_clip.shp shapefile. This shapefile is added as a GIS layer; however it is not “officially” part of your project. It can now be converted into a WMS coverage in a much simpler manner, however before we convert it to a WMS coverage, we want to join the IDs_for_WMS.dbf file to it.
The next step is to create the soil type coverage in WMS to receive the polygons.
Now we can convert the shapefile to a coverage.
Cleaning up the Soil Type Coverage
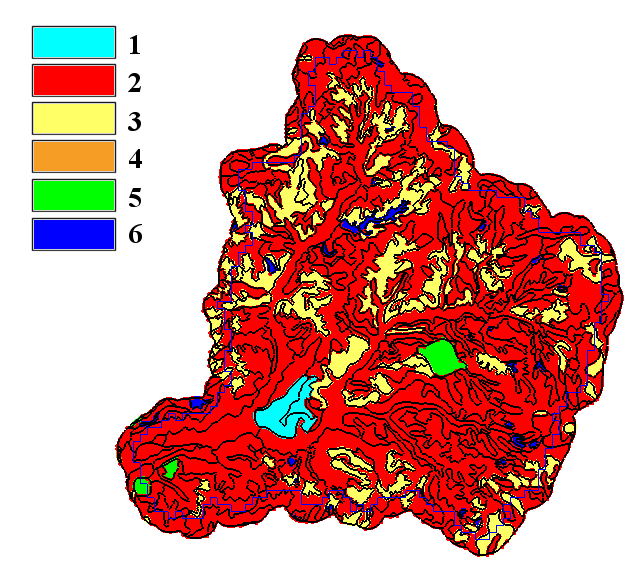
Let’s visualize the soil type coverage.
- In the 2D Grid Module
 select Display | Display Options.
 - Turn off all of the 2D Grid options except the boundary.
- Click OK.
- In the Data Tree, uncheck the land use and GSSHA™ coverages.
- In the Data Tree, select the Soil Type coverage.
- Select Display | Display Options.
- Switch to the Map Data tab.
- Under the Polygons field, turn on the Color Fill Polygons.
- Select Soil Type Display Options.
- Set up the colors and patterns to make them more visible. Pick colors similar to the following image. Select OK when you are done.
- In the Points/Nodes area, turn off the Points/Nodes and the Vertices.
- In the Legends field, turn on the Soil Type legend.
- Select OK.
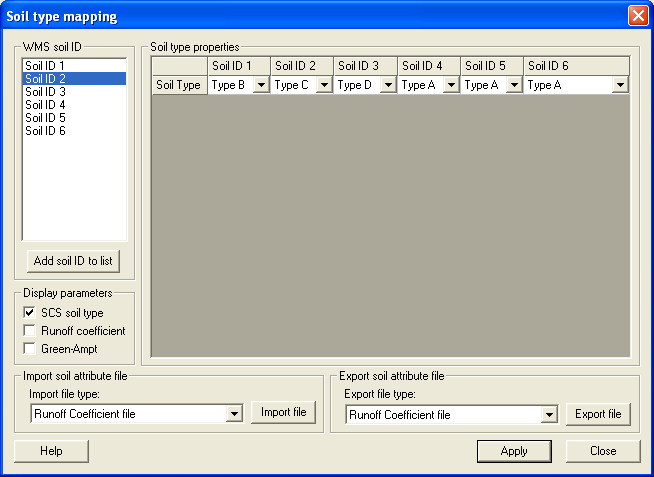
- Using the Pan, Zoom, and Select Polygon tools change the soil polygon IDs for Soil ID 1 (cyan) and Soil ID 6 (blue) to be what their neighbors are. This is accomplished by double-clicking on the desired polygon. This will bring up the Soil type mapping dialog as shown in the figure below. The soil type ID is changed in the WMS soil ID field. Click ‘Apply’
- Repeat step 14 for all the soil polygons of type 1 and 6.
Setting up the index map
Now we can make an index map out of the soil type coverage. The index map will be used to describe the spatial variability of the infiltration parameters for the simulation.
- Switch to the 2D Grid Module
 .
. - Select GSSHA™ | Maps…
- For the coverage use the Soil Type coverage. Set the Coverage attribute to be ID. Do not use a second GIS data source.
- Change the result name to Soil Type
- Click on Coverages -> Index Map
- Select Done.
- In the 2D Grid module
 select GSSHA™ | Job Control.
 - In the Job Control dialog change the infiltration option to Green + Ampt with Soil Moisture Redistribution.
- Click OK.
- In the 2D Grid Module
 select GSSHA™ | Map Tables….
 - Select the infiltration tab.
- In the Using index map box choose Soil Type.
- Select Generate IDs.
- Using the following table, enter the values for each parameter.
- Select the Initial Moisture tab in the process window.
- In the Using index map combo box select the uniform map.
- Select Generate IDs.
- Enter a value of 0.3 for the initial moisture.
- Click Done.
Now we have an index map of the soils shapefile. Now we need to turn on the infiltration parameters in the Job Control.
Now we can set up the mapping tables for infiltration.
The Generate IDs from Map button created three IDs, 2, 3, and 5. You will recall from when we created the land use index map that these three IDs came from the polygon IDs 2, 3, and 5. So the soil type index map ID #2 represents silt loam soils; the index map #3 represents silty clay loam; and the ID #5 represents silt.
|
You can now save the model and run.
Visualization
Since no water ran off we can guess that it all infiltratated. But let’s check to make sure.
- In the data tree, under the solution that was just read in, double-click on the summary file.
- Verify that there are no mass balance errors, check the amount that it rained and the amount that infiltrated, and close the file.
- In the 2D Grid Module select GSSHA™ | Precipitation.
- Increase the precipitation rate to 25 (mm/hr).
- Select OK.
- Select GSSHA™ | Job Control
- Select Output Control...
- Turn on Cumulative Infiltration Depth and Infiltration Rate.
- Select OK.
- Select OK.
Since we need more water lets increase the precipitation.
Let’s also turn on the infiltration output options.
Save and run the simulation. You can now use the same techniques from Chapter 2 to visualize the infiltration data sets.
One of the more interesting movies you can make is of the Infiltration Depth data set (To turn this dataset on, open the GSSHA Job Control window, click on Output Control, and toggle on the Cumulative Infiltration depth dataset. The two different soil types saturate at different rates and make for a pretty impressive movie.
GSSHA Tutorials
GSSHA Tutorial Download Website

