Tutorials:4 Using the Mapping Table and GIS Data
This tutorial is compatible with:
- WMS Version 8.1 and later
- GSSHA Version 3.0b and later
Disclaimer: GSSHA tutorial exercises do not represent real world conditions
Using Land Use Data
So far in our model we have set up uniform roughness and precipitation conditions. Setting up non-uniform precipitation will be covered in a later chapter. We shall now look at setting up spatially varied roughness coefficients. Describing the spatial variability of almost all parameters is done through setting up an index map and a mapping table. The index map is a grid of ID numbers. The ID numbers refer to numbers in the mapping table. Index maps are generic and may apply to any number of tables. Each table lists the name of the index map associated with the table and all the IDs that the index map (should or could) have, along with parameters for the IDs. We will be using a land use GIS file to create the IDs for the index map to be used with the roughness table.
- Start from where the previous chapter ended or you can open up the clean_ov project in the Finished_tutorial/clean_ov folder. (If you starting from here, you will notice in the Coverage that Land Use already exists.)
- Select File | Open…
- Browse to the Landuse folder in the project folder.
- Click on jb_luse_poly.shp. Click Open. The shapefile will be added as a GIS layer (not a feature object coverage).
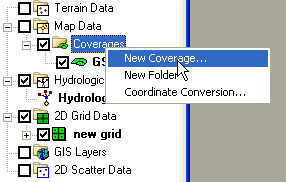
- Right-click on Coverages and select New Coverage.
- Change the Coverage Type to Land Use. Click Ok.
- Make sure the Land Use coverage is the current active coverage by clicking on it in the Coverage list.
- Select the jb_luse_poly.shp GIS layer by clicking on it. Notice that this changes the active module to the GIS module.
- Select Mapping->Shapes to Feature Objects.
- Click yes on when asked to use all shapes in visible shapefile for mapping.
- Click Next.
- Click Next to accept the default attribute mappings.
- Click Finish.
- Switch to the 2D Grid Module
 .
. - Select GSSHA™ | Maps…
- For the coverage use the Land Use coverage. Do not use a second GIS data source.
- Change the Index map name to Land Use.
- Click on Coverages -> Index Map.
- Select Done.
- Click on the ‘uniform’ index map in the data tree.
- Click on the ‘Land Use’ index map in the data tree.
- Select GSSHA™ | Map Tables…
- Select the Roughness tab if it is not already selected.
- Under Using index map choose the Land Use index map.
- Click on Generate IDs. Click yes when asked to delete the process’ existing IDs.
- Fill out the Roughness values according to the table below. To enter a roughness value for an ID, highlight the surface roughness box below the ID then edit the roughness value. (You may also edit the descriptions if you wish, however you should leave the original polygon ID description as is.)
- Once you are done, select Done.
We now have a land use coverage in WMS. Zoom into the GSSHA™ model area. You can turn off the display of the jb_luse_poly.shp GIS layer by unchecking the box next to it. Using the Select Polygon tool ![]() double-click a polygon inside the grid. The land use mapping dialog will open. Notice that there are 10 land use types.
double-click a polygon inside the grid. The land use mapping dialog will open. Notice that there are 10 land use types.
| ||||||||||||||||||||||
Now we can make an index map out of the land use coverage. The index map will be used to describe the spatial variability of roughness values for the simulation.
If you expand the 2D Grid part of the Data Tree you’ll notice that there are now two index maps listed, uniform and Land Use. Let’s visualize them as well.
The grid should appear solid red. This is because the uniform map is all ones.
The grid should now have cells colored in several colors representing the IDs of the polygons that were mapped to the grid cells. Next we will assign the Land Use index map to the roughness table and set up roughness values for each of the IDs in the Land Use index map.
|
You can now save the model and run the simulation.
GSSHA Tutorials
GSSHA Tutorial Download Website
