Tutorials:1 Initial Overland Flow Model Setup
This tutorial is compatible with:
- WMS Version 8.1 and later
- GSSHA Version 3.0b and later
Disclaimer: GSSHA tutorial exercises do not represent real world conditions
Contents
[hide]Initial Basin Setup
To start a GSSHA™ model, you must have a digital elevation model and a boundary polygon for the watershed. For this tutorial we will use a DEM as the elevation model and also create the boundary polygon and the streams. WMS uses the DEM to interpolate cell elevations and the boundary polygon to select whether or not a cell is active (inside the basin) or inactive (outside the basin.) Unlike lumped parameter watershed models, the basin should not be subdivided into sub-basins. There should only be one basin boundary. The following steps are the same steps used to begin all watershed models in WMS. For more information, consult the WMS 8.0 Tutorials.
Open the DEM (select the Judys_branch.hdr file in the DEM folder. At the ‘Importing NED BIL File’ dialog, click ‘OK’. When the convert coordinates now dialog pops up, say yes and then turn on the ‘Edit project coordinate system’. Convert from the Geographic NAD 83 to UTM NAD 83 and pick the UTM Zone 16.)
- Click ‘OK’.
- Highlight Watershed icon.

- Use TOPAZ by selecting DEM | Compute TOPAZ Flow Data.
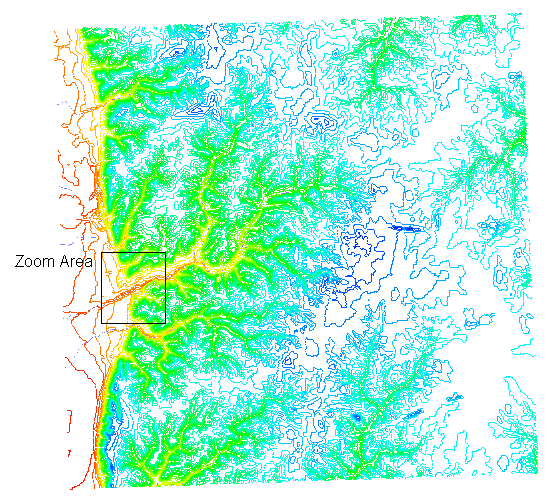
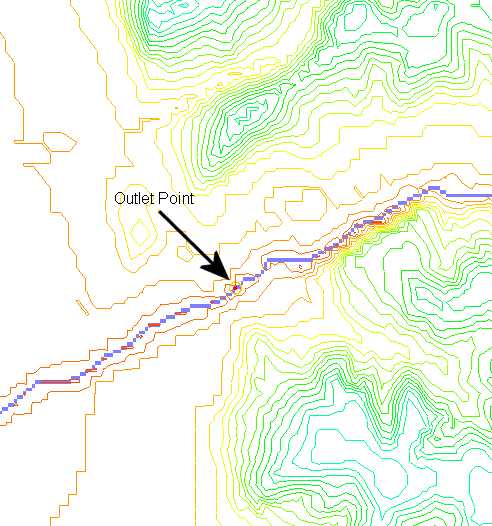
- After running TOPAZ, locate the outlet. The outlet location is shown in the following figures. Using the zoom tool
 zoom into the area shown in the following figure and locate the outlet.
 - Create an outlet point using the ‘create outlet’ feature
 . Make sure this point is on the ‘blue’ stream line.
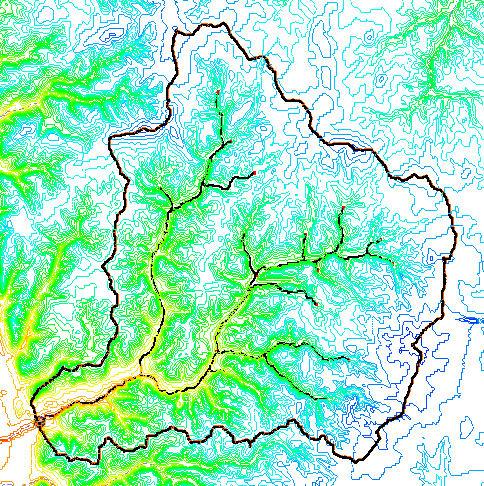
 - Create the Basin and Stream Arcs using the Delineate Basin Wizard. This is found in the DEM file menu. Use a threshold value of 0.2. The finished basin should look like the following figure.
- Save your project.
Initial Grid Setup
The basic GSSHA™ model begins with the basin boundary in the Drainage coverage and a DEM. It is helpful to have the streams already set up as well, but not necessary. In this step you are essentially telling WMS to take the boundary polygon and the DEM and create a 2D grid that fits the boundary and has an elevation data set that is interpolated from the DEM. For more information on selecting appropriate cell sizes see the GSSHA™ Primer. (http://chl.erdc.usace.army.mil/software/GSSHA™/Primer_20/wf_njs.htm)
- Begin from Basin Setup (You can load the delin_basin.wpr file in the Finished_tutorials\delin_basin folder if you are starting from here.)
- In the Map Module
 , using the Select Polygon tool
  , select the basin boundary polygon.
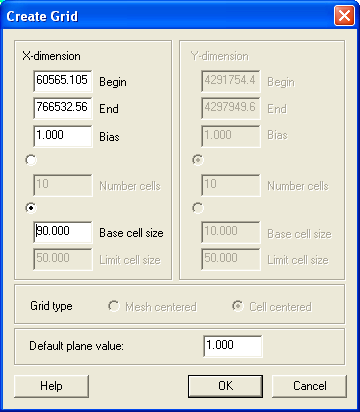
 - Select Feature Objects | Create Grid… (Select Yes for GSSHA™ grid.)
- Select the second toggle, the one for base cell size, and enter 90 (meters.) Select OK.
- Hit OK on the Background Elev Interpolation dialog.
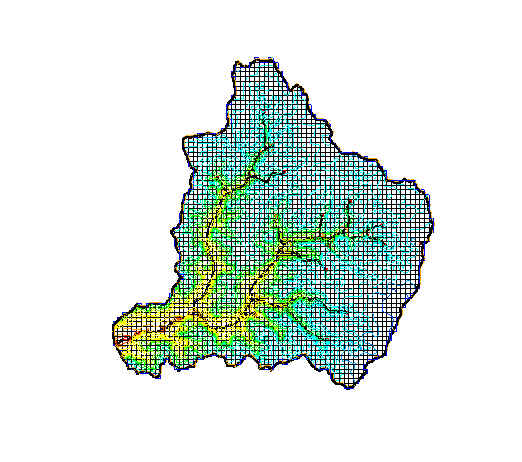
Hit Yes on the Delete Existing Background DEM dialog. The basin should now look like the following figure.
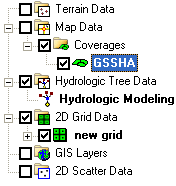
You’ll notice in the data tree that the Drainage coverage has now changed name (and changed type as well) to the GSSHA™ coverage. A 2D Grid called new grid is also in the tree now.
Job Control Setup
In the last step, the GSSHA™ Job Control parameters were initialized using the default values, which are mostly zero. It is best to start with some realistic values.
- In the 2D Grid module
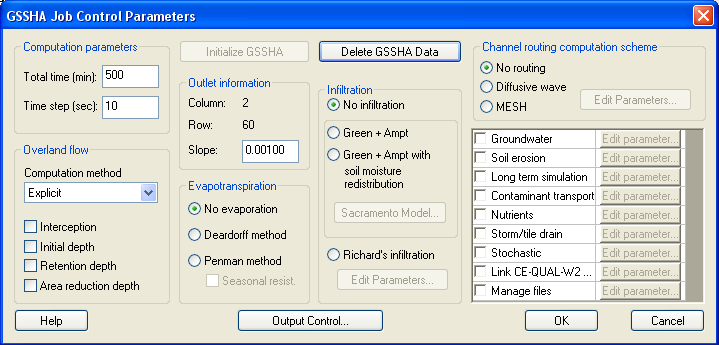
 select GSSHA™ | Job Control …
 - Enter an outlet slope of 0.001.
- Enter a time step of 10 (seconds) and a total run time of 500 (minutes).
- Select OK.
Uniform Index Map Setup
Once the Job Control parameters are set to more realistic values, there are two main areas to set up for overland flow. First, the overland flow roughness coefficients need to be set and secondly, the precipitation data needs to be specified. There are two parts to setting up the overland flow roughness coefficients; first an index map must be set up that describes the spatial variation of the roughness and secondly, the roughness values themselves must be set. We shall create a spatially uniform set of roughness values.
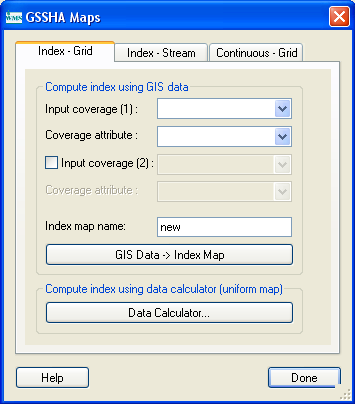
- Select GSSHA™ | Maps… (Notice that an Index Map Folder was created when the grid was created.) This will bring up the GSSHA™ Index Maps dialog.
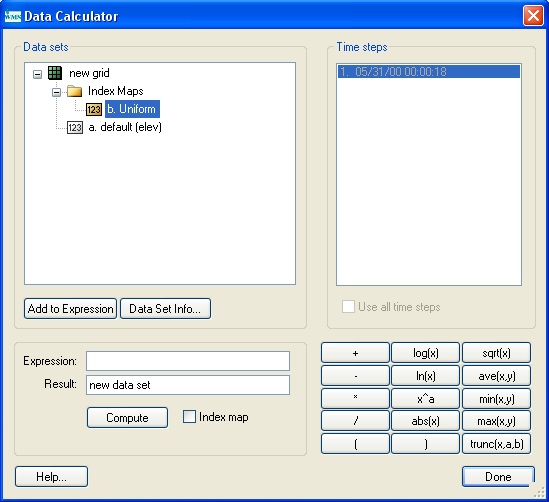
- Select Data Calculator. This will bring up the Data Calculator dialog.
- In the Expression box, type 1.
- In the Result box, type Uniform
- Check the ‘Index map’ option
- Select Compute.
- Then, select Done. This takes you back to the Index Map dialog.
- Select Done.
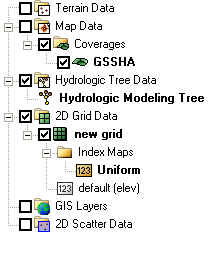
We have just populated an index map (a grid) with the value 1. If you expand the data tree you will notice that our new index map has been added to the index maps folder under the 2D grid folder.
Roughness Table Setup
Notice that when we made the index map we assigned a value of 1 to the whole map. The 1 is an index number, and we shall now relate the index number to a roughness coefficient. This is done through the mapping table.
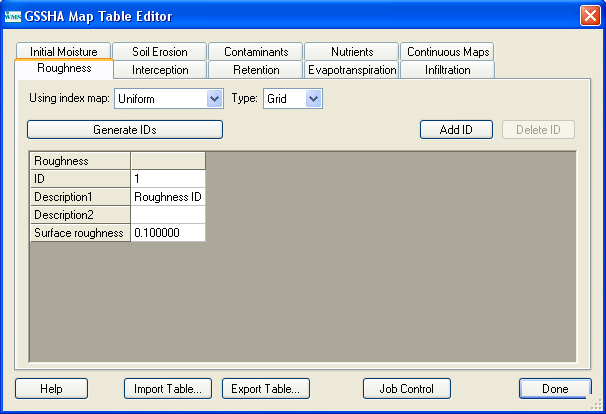
- Select GSSHA™ | Map Tables...
- Select the Roughness tab.
- In the Using Index Map combo box select “uniform”.
- Select Generate IDs.
- In the ID field, type 1
- In the Surface Roughness edit field, enter a value of 0.1.
- Select Done.
The tabs on the Mapping Table dialog list some of the mapping tables that can be set up. We will set up other mapping table processes in future tutorials. Through these two steps we have set up the spatial variability of the roughness value (by assigning it the uniform index map) as well as assigned roughness values to the IDs in the map.
Setting the Uniform Precipitation
Besides the roughness, the precipitation must be set up in order to run the basic model. GSSHA™ can run multiple events in long-term mode only, so for now we will set up a single rainfall event. To simplify the process, we will set up a simple uniform precipitation event for a short duration.
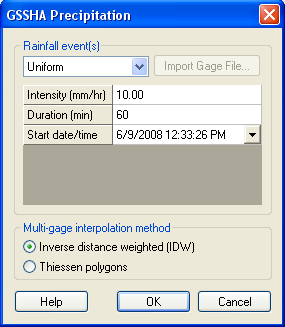
- Select GSSHA™ | Precipitation …
- Select the Uniform Rainfall Option.
- Enter the rainfall intensity of 10 (mm/hr).
- Enter the rainfall duration of 60 (minutes).
- You can change the start date/time to be what you like.
- Select OK.
Save the GSSHA™ Model
It is advisable to create a new folder each time a significant revision is made and save the project in it. Unfortunately, there is no way to make a new folder in the current save project file dialog and this must be done externally. Once you have made the new folder, if desired:
- Select GSSHA™ | Save Project File…
- Browse to the folder where you wish to save the project.
- Enter file name.
- Select Save.
Typically, most of the files share a similar base file name and only differ in extension. The exceptions to the rule are the index maps, which all have the same extension and different base file names. The file names and extensions may be any name desired; the defaults given in WMS are merely convention, but they do aid in quickly identifying files when you are rummaging through them. The following table lists a few of the extensions used by convention.
| Extension | Description |
|---|---|
| prj | Project file |
| ele | Elevation file |
| msk | Watershed mask |
| cmt | Mapping table file |
| cif | Channel input file |
| gst | Grid-Stream file |
| idx | Index map |
| dep | Overland depth map (output) |
| cdp | Channel depth file (output) |
| cdq | Channel discharge file (output) |
| map | WMS map file (not used by GSSHA™) |
Running the Model
- Select GSSHA™ | Run GSSHA™
- Select OK.
After looking through the output, you’ll notice that not a lot of water ran off the watershed. Often at this point in the development the simulation will not run to completion. The problem is usually due to digital dams. Digital dams are artificial depressions in the 2D Grid that cause water to pond. How to fix digital dams is the subject of a following chapter.
GSSHA Tutorials
GSSHA Tutorial Download Website
