Difference between revisions of "Tutorials:13 Sediment"
From Gsshawiki
(No difference)
|
Latest revision as of 20:07, 23 March 2010
This tutorial is compatible with:
- WMS Version 8.2 and later
- GSSHA™ Version 4.0 and later
Disclaimer: GSSHA tutorial exercises do not represent real world conditions
This tutorial builds on the the previous tutorial, Tutorial 12: Groundwater.
If you are starting at this tutorial,
- In the 2D Grid Module
 select GSSHA™ | Open Project File.
 - Browse to the Sediments folder.
- Select the EauGalleGSSHASed.prj file and select Open.
This is a GSSHA™ model of the Eight Mile Run basin in the Eau Galle River watershed in Wisconsin. This is a long-term model with groundwater parameters included.
Contents
Adding Soil Erosion
Adding Sediment
- Click the Edit parameter... button next to the soil erosion spreadsheet option
- Make sure the Transport capacity is set to Kilinc-Richardson
- Click the Add button three times to add three Sediments
- Fill in the Sediments spreadsheet with values from the following table:
- Click OK to close the Overland soil erosion dialog
- Click the Edit Parameters... button in the Channel routing computation scheme portion of the Job Control dialog (top right corner).
- Make sure the Sediment porosity is set to 0.4, the Water temperature at 20.0 deg C, and the Sand size at 0.25 mm.
- Leave all other values at their defaults and click OK to close the GSSHA™ Channel Routing Parameters dialog
- Click OK to close the GSSHA™ Job Control dialog
|
Specifying Soil Erosion Parameters
- In the 2D Grid Module
 select GSSHA™ | Map Tables...
 - Click on the Soil Erosion tab.
- In the Using index map combo box, select the Combined index map
- Click Generate IDs
- Fill in the spreadsheet with values from the following table:
- Click Done to close the GSSHA™ Map Table Editor
|
Saving and Running the Model
- In the 2D Grid Module
 select GSSHA™ | Save Project File...
 - Change the project name to EauGalleGSSHASed1.prj and click Save
- In the 2D Grid Module
 select GSSHA™ | Run GSSHA™...
 - Toggle on the option to suppress screen printing and click OK
- Once the model is done running, make sure Read solution on exit is toggled on and click Close.
Post-Processing
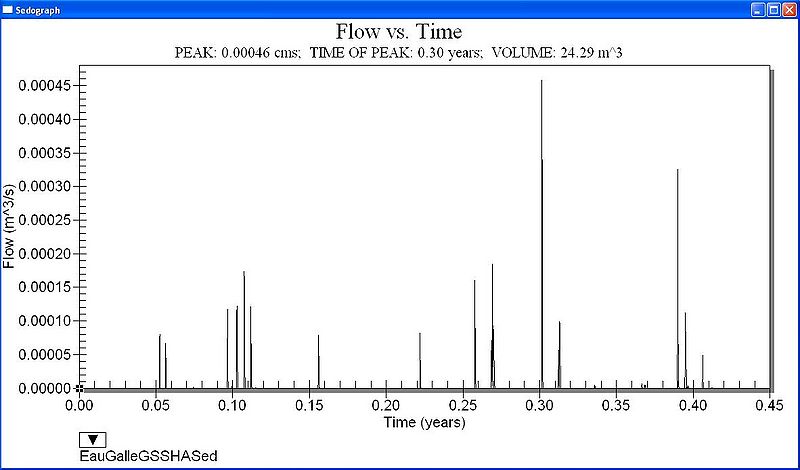
- In the Project Explorer, right-click on the Outlet Sedograph, located below the GSSHA™ solution folder (the folder with the letter "S" on it)
- Select View Graph...
- The plot window should show the sedograph, which should look similar to Figure 39.
- Close the sedograph plot.
If you wish to view more sediment related output, go into the GSSHA™ Job Control, click on Output Control, and toggle on any datasets you would like GSSHA™ to output. Then save your project and run it again.
This concludes the GSSHA™ Sediment tutorial.
GSSHA Tutorials
GSSHA Tutorial Download Website
