Tutorials:17 Nutrients
This tutorial is compatible with:
- WMS Version 8.2 and later
- GSSHA Version 5.0 and later
Disclaimer: GSSHA tutorial exercises do not represent real world conditions
Two types of reactive constituent transport are available in GSSHA. As explained in the GSSHA wiki, constituents can be simulated as simple first order reactants. The nutrient cycle can also be simulated with the Nutrient Sub-Model (NSM). In either case, the overall simulation methods within the GSSHA model are the same. Only the rates of mass absorption and decay are different. It is then possible to simulate nutrients as simple constituents, as well as simulating them with the full nutrient cycle.
Modeling of nutrients in NSM consists of three distinct parts. The first part deals with simulating the nitrogen (N) and the phosphorus (P) cycle in the soil, whereas the second part focuses on the transformation and loading of N and P species in the overland flow. The third part simulates the most important processes for N and P cycle, dissolved oxygen and phytoplankton kinetics and can be used as a basic in-stream water quality model.
Contents
[hide]Open the Base Model
- In the 2D Grid Module
 select GSSHA™ | Open Project File.
 - Browse to the Judy's_Branch_tutorial/NSM directory and open the file named nsm1.prj.
- In the 2D Grid Module
 select GSSHA™ | Save Project File.
 - Browse to the Judy's_Branch_tutorial/NSM/Personals directory and save the file as nsm1.prj.
Setting up a GSSHA simulation with NSM constituents requires first a running hydrology model that includes simple constituents just to see that the model is transporting constituents appropriately. Once this is working, the NSM constituents can be set up. This base model has already been set as a long term simulation model with two simple constituents, as well as precipitation data and meteorological data for one week. If you have questions on how to set a long term simulation model or a simple constituent model, please refer to the the Long Term Simulations Tutorial and the Simple Constituent Transport Tutorial.
Adding NSM Constituents
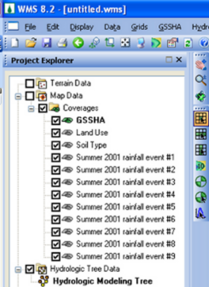
- Make sure that your project has 12 coverages, 9 of which should be rainfall events as shown in Figure 1 . GSSHA™ should be the active coverage in the Project Explorer.
- Select the 2D Grid Module
 if not already selected. Go to GSSHA™ | Job Control.
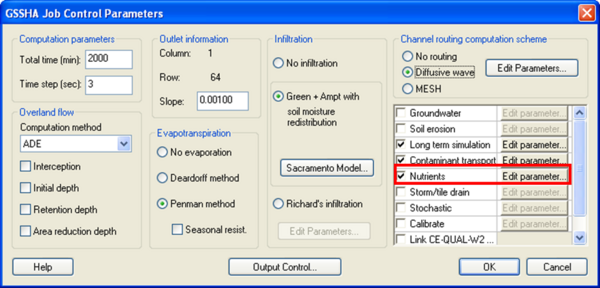
 - In the dialog box that opens, click on the box beside Nutrients to select this option. Make sure that Long Term Simulation and Contaminant Transport are also selected. See Figure 2.
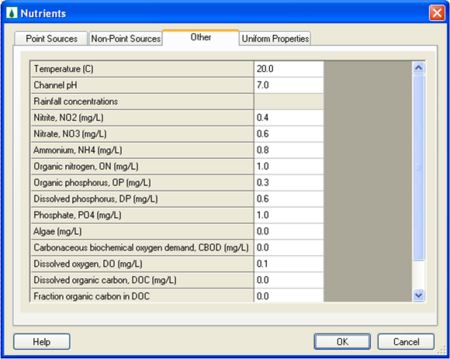
- Click on the Edit parameter button for Nutrients. In the dialog box that opens, you can see four tabs: Point-Source, Non-Point Source, Other and Uniform Properties as shown in Figure 3. click on the Other tab.
In the Other tab you will see a list of parameters. Only temperature and channel pH have values assigned. The other parameters refer to rainfall concentrations for each constituent. In real life, we may or may not know the rainfall concentration of each constituent being simulated and in this case values of zero can be assigned. In addition, these concentrations may vary for each rainfall event as they are dependent on pollution at a given time. For the purpose of this tutorial, enter the following values:
| Parameter | Rainfall Concentrations |
|---|---|
| NO2 | 0.4 mg/L |
| NO3 | 0.6 mg/L |
| NH4 | 0.8 mg/L |
| Organic Nitrogen | 1.0 mg/L |
| Organic Phosphorus | 0.3 mg/L |
| Dissolved Mineral Phosphorus | 0.6 mg/L |
| Phosphate | 1.0 mg/L |
| Algae | 0.5 mg/L |
| CBOD | 1.0 mg/L |
| Dissolved Oxygen | 10 mg/L |
| Dissolved Organic Carbon (DOC) | 1.0 mg/L |
| Fraction of Organic Carbon in DOC | 0.5 |
Notice that contaminant 1 (1 mg/L) and contaminant 2 (0.5 mg/L) are included in this dialog box. The concentrations should be the same as the ones previously specified in the contaminant transport dialog box.
- Click OK to close the nutrients dialog box.
- Next to the Long Term Simulation check box, click on Edit parameters . In the dialog box that opens, toggle on the Use Soil Contaminant Transport and enter the following: Top Layer depth:1m, Mixing Layer Depth:0.5m
- Make sure your soil moisture depth is set to 1.5m. Click OK to close the Continuous Simulation Dialog Box. Click ok to close the Job Control Dialog box.
The next step in setting an NSM Model is to create a Stream Index Map. This map is used to input aquatic kinetic constants for the stream network.
- With the 2D grid
 as your active module, go to GSSHA™ | Maps.
 - In the dialog box that opens, select the Index-Stream Tab
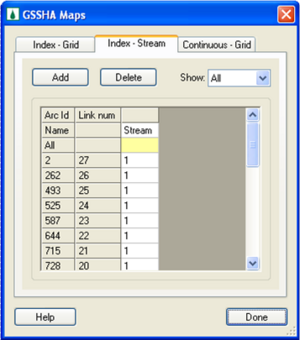
- Click the Add button and rename your index map as "Stream". See Figure 4.
- Click Done.
- With the 2D grid
 as your active module, go to GSSHA™ | Map Tables. Values for Roughness, Evapotranspiration, Infiltration, Initial Moisture and Contaminants should already be defined. We will now fill in the values for Nutrients.
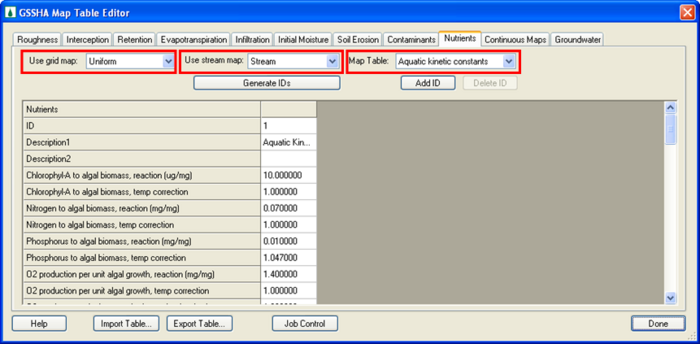
 - Click on the Nutrients Tab. You will see three drop down menus, one for a grid map, one for a stream map and one for a map table as shown in Figure 5. From the Grid Map Drop down Menu select "Uniform". From the Use Stream Map select "Stream" and from Map table Select "Aquatic Kinetic Constants".
- Click Generate IDs . You will have one column of values as we are using a Uniform Index Map. Notice that in the Use grid map drop down menu you had the option of choosing between Uniform, Land Use, Soil Type and Combined Index Maps. The index map you use will depend on the nature of your model. The Uniform Index map can be used to set up your model and make sure it is working as it simplifies the setup, but it does not necessarily represent real-world conditions.
- WMS populates the column with default values and we will use those default values in this tutorial. Notice that the dispersion coefficients were assigned values of zero. Please enter the following values:
| Parameter | Dispersion Coefficient |
|---|---|
| NO2 | 0.5 mg/L |
| NO3 | 0.3 mg/L |
| NH4 | 0.35 mg/L |
| Organic Nitrogen | 0.4 mg/L |
| Organic Phosphorus | 0.2 mg/L |
| Dissolved Phosphorus | 0.4 mg/L |
| Phosphate | 0.3 mg/L |
| Algae | 0.0 mg/L |
| CBOD | 0.0 mg/L |
| Dissolved Oxygen | 0.01 mg/L |
- In the Map Table drop down menu there are 13 other options that require values. Select each one of the map table options, and generate IDs for each one using the maps indicated in Table 3.
- Input the values found also in Table 3.
| Index Map | Index Map Type | Map Table | Parameter | Value |
|---|---|---|---|---|
| Stream | Stream | Dispersion | Dispersion Coefficient | 0.5 |
| Uniform | Grid | Dispersion | Dispersion Coefficient | 0.5 |
| Stream | Stream | Nitrogen Initial Conditions | Nitrite | 1.0 |
| Stream | Stream | Nitrogen Initial Conditions | Nitrate | 1.5 |
| Stream | Stream | Nitrogen Initial Conditions | Ammonium | 0.5 |
| Stream | Stream | Nitrogen Initial Conditions | Organic Nitrogen | 2.0 |
| Uniform | Grid | Nitrogen Initial Conditions | Nitrite | 1.0 |
| Uniform | Grid | Nitrogen Initial Conditions | Nitrate | 1.5 |
| Uniform | Grid | Nitrogen Initial Conditions | Ammonium | 0.5 |
| Uniform | Grid | Nitrogen Initial Conditions | Organic Nitrogen | 2.0 |
| Stream | Stream | Phosphorus Initial Conditions | Organic Phosphorus | 2.0 |
| Stream | Stream | Phosphorus Initial Conditions | Dissolved Phosphorus | 1.0 |
| Stream | Stream | Phosphorus Initial Conditions | Phosphate | 0.5 |
| Uniform | Grid | Phosphorus Initial Conditions | Organic Phosphorus | 2.0 |
| Uniform | Grid | Phosphorus Initial Conditions | Dissolved Phosphorus | 1.0 |
| Uniform | Grid | Phosphorus Initial Conditions | Phosphate | 0.5 |
| Stream | Stream | Carbon Initial Conditions | Dissolved Organic Carbon | 3.0 |
| Stream | Stream | Carbon Initial Conditions | Fraction of Organic Carbon in DOC | 0.5 |
| Uniform | Grid | Carbon Initial Conditions | Dissolved Organic Carbon | 3.0 |
| Uniform | Grid | Carbon Initial Conditions | Fraction of Organic Carbon in DOC | 0.5 |
| Stream | Stream | Other Initial Conditions | Algae | 0.0 |
| Stream | Stream | Other Initial Conditions | CBOD | 40.0 |
| Stream | Stream | Other Initial Conditions | Dissolved Oxygen | 6.0 |
| Uniform | Grid | Other Initial Conditions | Algae | 0.0 |
| Uniform | Grid | Other Initial Conditions | CBOD | 0.0 |
| Uniform | Grid | Other Initial Conditions | Dissolved Oxygen | 0.0 |
| Uniform | Grid | Soil Nitrogen Initial Conditions | Ammonium Loading | 0.1 |
| Uniform | Grid | Soil Nitrogen Initial Conditions | Nitrate Loading | 0.5 |
| Uniform | Grid | Soil Nitrogen Initial Conditions | Organic Active Nitrogen Loading | 2.0 |
| Uniform | Grid | Soil Nitrogen Initial Conditions | Organic Free Nitrogen Loading | 2.0 |
| Uniform | Grid | Soil Nitrogen Initial Conditions | Organic Stable Nitrogen Loading | 1.0 |
| Uniform | Grid | Soil Phosphorus Initial Conditions | Mineral Active Phosphorus Loading | 3.0 |
| Uniform | Grid | Soil Phosphorus Initial Conditions | Mineral Soluble Phosphorus Loading | 0.0 |
| Uniform | Grid | Soil Phosphorus Initial Conditions | Mineral Stable Phosphorus Loading | 1.0 |
| Uniform | Grid | Soil Phosphorus Initial Conditions | Organic Active Phosphorus Loading | 0.5 |
| Uniform | Grid | Soil Phosphorus Initial Conditions | Organic Free Phosphorus Loading | 0.0 |
| Uniform | Grid | Soil Phosphorus Initial Conditions | Organic Stable Phosphorus Loading | 1.0 |
| Uniform | Grid | Soil Carbon Initial Conditions | Dissolved Organic Carbon | 2 |
| Uniform | Grid | Soil Carbon Initial Conditions | Fraction of Organic Carbon in DOC | 0.7 |
| Uniform | Grid | Soil Uptake Rates | for Nitrite | 1.0 |
| Uniform | Grid | Soil Uptake Rates | for Nitrate | 1.0 |
| Uniform | Grid | Soil Uptake Rates | for Ammonium | 1.0 |
| Uniform | Grid | Soil Uptake Rates | for Organic Nitrogen | 1.0 |
| Uniform | Grid | Soil Uptake Rates | for Organic Phosphorus | 1.0 |
| Uniform | Grid | Soil Uptake Rates | for Dissolved Mineral Phosphorus | 1.0 |
| Uniform | Grid | Soil/Water Partitioning | for Nitrite | 0.3 |
| Uniform | Grid | Soil/Water Partitioning | for Nitrate | 0.5 |
| Uniform | Grid | Soil/Water Partitioning | for Ammonium | 0.4 |
| Uniform | Grid | Soil/Water Partitioning | for Organic Nitrogen | 0.6 |
| Uniform | Grid | Soil/Water Partitioning | for Organic Phosphorus | 0.4 |
| Uniform | Grid | Soil/Water Partitioning | for Dissolved Mineral Phosphorus | 0.5 |
| Uniform | Grid | Groundwater Nitrogen Initial Conditions | Nitrite | 0.05 |
| Uniform | Grid | Groundwater Nitrogen Initial Conditions | Nitrate | 0.36 |
| Uniform | Grid | Groundwater Nitrogen Initial Conditions | Ammonium | 0.65 |
| Uniform | Grid | Groundwater Nitrogen Initial Conditions | Organic Nitrogen | 0.2 |
| Uniform | Grid | Groundwater Phosphorus Initial Conditions | Organic Phosphorus | 3.0 |
| Uniform | Grid | Groundwater Phosphorus Initial Conditions | Dissolved Phosphorus | 1.0 |
| Uniform | Grid | Groundwater Phosphorus Initial Conditions | Phosphate | 2.6 |
| Uniform | Grid | Groundwater Other Initial Conditions | CBOD | 0.0 |
| Uniform | Grid | Groundwater Other Initial Conditions | Dissolved Oxygen | 10 |
The last step before saving and running your model is specifying the output files you want to simulate and display in WMS.
- In the 2D grid
 module, select GSSHA™ | Job Control
 - Click on Output Control.
- In the Data Type Drop Down Menu, select Nutrients-Overland.
- You will see a list of nutrients that can be simulated in the overland flow. Turn output on for all of the nutrients.
- Scroll down the Link/Node Data sets options. You will see a list of nutrient output that can be turned on for nodes in the stream network. Select all of them starting from Stream Nitrite and ending with Stream dissolved oxygen. Your dialog box should look something like Figure 6.
- Click OK to close the GSSHA Output Control dialog box. Click OK to close the GSSHA Job Control dialog box.
Save and Run the Contaminants Model
- In the 2D Grid Module
 select GSSHA™ | Save Project File.
 - Save the file as nsm1.prj
- When prompted to replace the existing file, click yes.
- Select GSSHA™ | Run GSSHA™.
- When GSSHA™ is done running, make sure the option to Read solution on exit is toggled on and click Close.
View Results
There are several different outputs generated when running the model. In the outlet location, you should get two constituent graph solutions, one for Constituent Mass and one for Constituent Concentration.
- In the Project Explorer, right-click on the Outlet Constituent Mass graph, located below the GSSHA™ solution folder (the folder with the letter "S" on it)
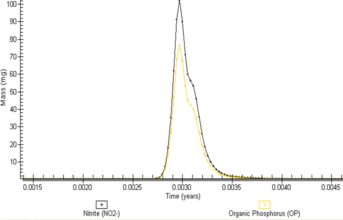
- Select View Graph. You have the option of selecting the constituents you want to view. For example, for nitrite and organic phosphorus, the graph should be similar to the one in Figure 7.
- Close the constituent plot.
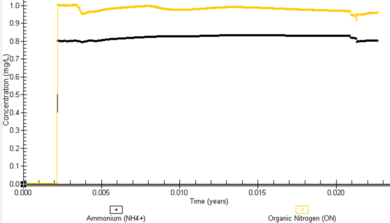
- You can follow the same steps for Constituent Concentration graph. A plot for the concentration of ammonium and organic nitrogen is shown in Figure 8.
To view overland contaminant mass and concentration, do the following:
- In the 2D Grid module
 select Display | Display Options
 - Turn on the 2D Grid Contours.
- Select OK.
- In the data tree, right-click on OV_no2_mass under the solution folder.
- Select Contour Options.
- Under Contour Method select 'Color Fill.'
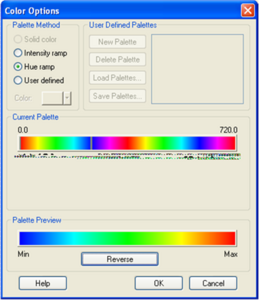
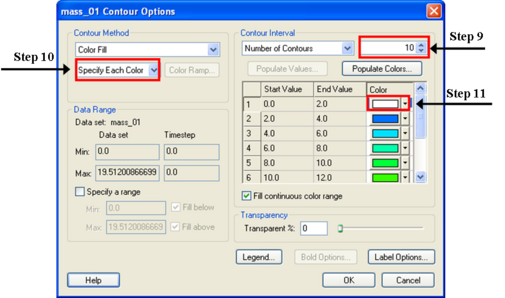
- Click on Color Ramp. A dialog box as shown in Figure 9 will appear. Click the Reverse button.
- Select OK.
- In the OV_no2_mass Contour options dialog, the number of contours should be defaulted to 20. Reduce this number to 10.
- In the Contour Method drop down menu that is defaulted as ‘use Color Ramp’, select ‘Specify each color’.
- You will note that the colors have now a drop down menu. Change your first color from blue to white. Leave the rest as they are. See Figure 10.
- Click OK to exit the dialog box.
A set of time steps appear in the right pane of your WMS window as you selected OV_no2_mass. Click around on a few of them between 2:45am-11:00p.m. on 08/24/2001. It would be helpful if we knew what the colors represented.
- Right-click on OV_no2_mass in the data tree.
- Select Contour Options.
- Turn on the legend.
- Click OK.
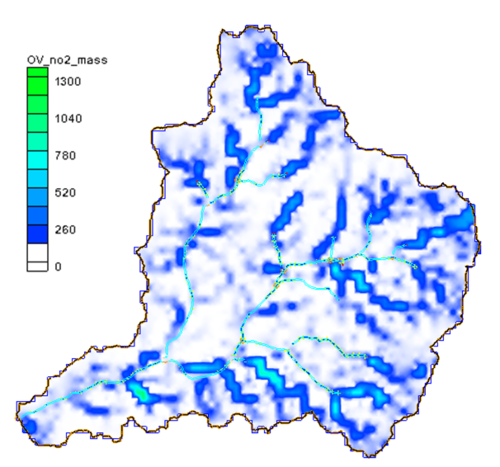
Your mass overland display for OV_no2_mass (08/24/01 at 9:45 am) should look something like Figure 11.
- You can follow steps from 4-16 if you want to visualize the rest of the constituents. Units of mass are in g/s and units of concentration are in mg/L.
In order to visualize mass and contaminant concentrations along the stream network, we need to turn on the contours for the 2D Scatter Data.
- In the project explorer, right click the
Link/node icon. Select the Display Options dialog.
- Turn on the contours for the 2D Scatter Data.
- Select a radius and Z Magnification (try a radius of 4 and a Z magnification of 50). If the lines are too big, you might need to decrease the Z magnification.
- Click OK.
- Select Dissolved P mass in the 2D Scatter Data folder in the data tree. Make sure that the Dissolved P mass is also selected for the overland plane (Under the Solution Folder in the Project Explorer).
- Select a time step other than the first one in the Properties window, such as 08/24/2001 between 7:00-12:00 am.
- If you rotate into 3D mode
 , or change from plan view
  to perspective view
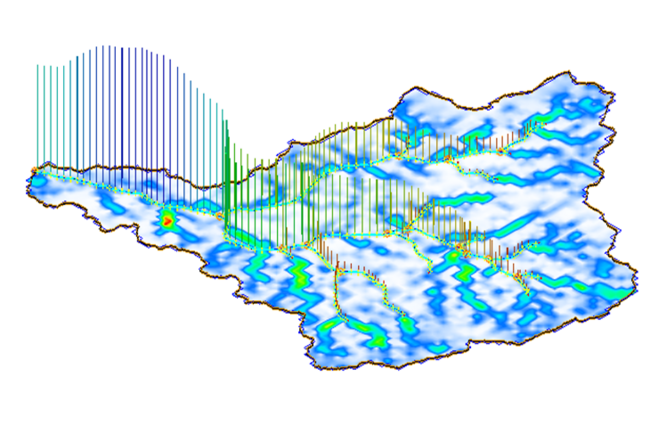
  , you will see the lines representing stream mass. In the properties folder you will see the time steps. As you select individual time steps the data for that time step both the 2D grid data and the 2D scatter data will be contoured.
Your display for Dissolved P mass on the stream network (08/24/2001 9:45 am) should look something like Figure 12:
If you want more information on the project results we can open the summary file and get information on this and the rest of the processes simulated.
- Double-click on Summary File under the solution folder.
- If WMS asks for your editor just click OK.
- Look through the summary file. Notice the kinetics of overland, stream and soil column constituent transport. It is also good to check things like mass balance and the volume remaining on the surface
- When you are done you can close the window.
This concludes the GSSHA™ NSM tutorial.
GSSHA Tutorials
GSSHA Tutorial Download Website
